Fabric and Azure
How Do I Build My First Pipeline in Microsoft Fabric?
Build a Fabric pipeline that loads a file daily, feeds a Direct Lake report with no refresh step, and shows every failed run. Tested on a trial.
Austin Levine
·
Updated
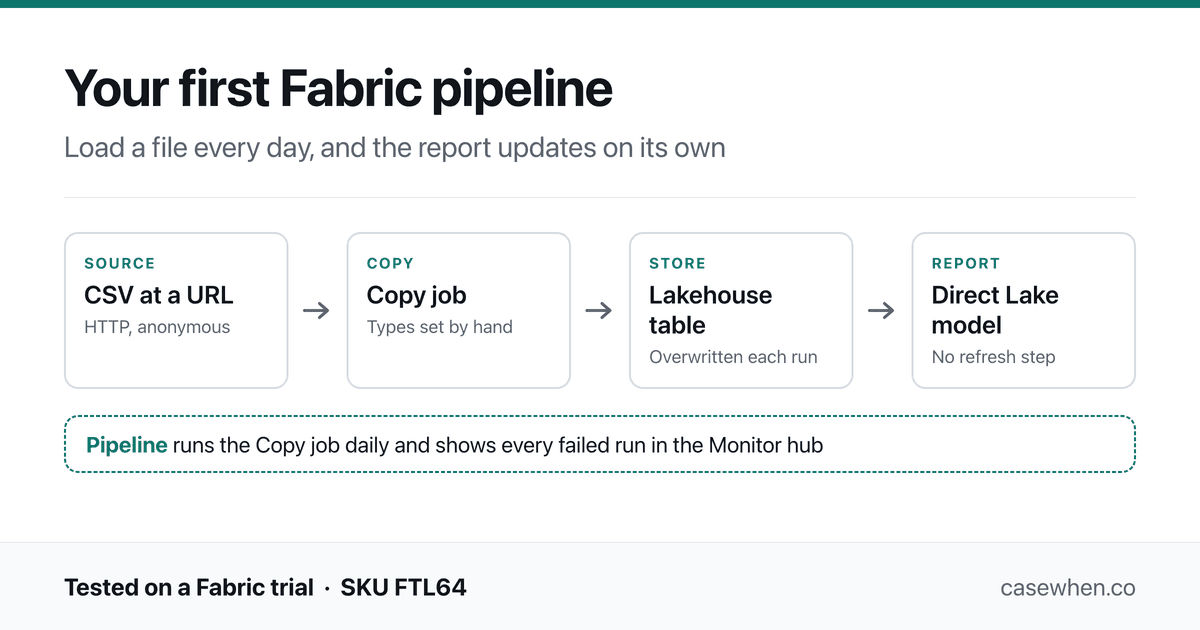
The build in this article, from source file to report.
Create a pipeline, run the Copy data assistant to load your file into a lakehouse table, and set the column types before you save. Then add a daily schedule. If your report reads the table through a Direct Lake semantic model, it shows the new data after every run with no refresh step. All of it works on the free Fabric trial.
Tested on a live Fabric trial capacity, SKU FTL64, loading a public CSV file over HTTP into a lakehouse and reading it through a Direct Lake semantic model.
What a pipeline is, and what this one builds
A pipeline in Fabric is the part that runs data work on a schedule. It does not move or change data itself. It runs steps in a set order, starts them at the time you choose, and records whether each one succeeded. The steps inside it do the actual work.
Almost every pipeline has the same four stages, and each stage uses a different Fabric tool:
Stage | What happens | Fabric tool in this article |
|---|---|---|
1. Get the data | Read it from where it lives, a file, database or API | Copy job |
2. Store it | Write it to a table in Fabric | Lakehouse table |
3. Serve it | Make the table available to reports | Direct Lake semantic model |
4. Run and watch | Start stage 1 on a schedule and record failures | Pipeline, plus the Monitor hub |
Fabric has several tools for stage 1. Workspace > New item lists them together under Get data: Copy job, Dataflow Gen2, Pipeline and Notebook, among others. A Copy job copies data as it is, which is all a first pipeline needs. Dataflow Gen2 reshapes data with Power Query on the way in, and a notebook does it in code. Dataflows vs Notebooks in Fabric compares those two.
Everything below runs on a Fabric trial. Pipelines, lakehouses and semantic models all work on a trial. Only the AI features are blocked. You also sign in once with your work account while setting up the pipeline.
You can follow along with the same data. The first file holds 1,000 daily sales orders: https://casewhen.co/samples/sales-orders.csv. A second file, used later to show the report updating, holds the same orders plus one more week, 1,085 in total: https://casewhen.co/samples/sales-orders-update.csv.
The Copy data assistant now creates a Copy job
Open your workspace and select New item, then Pipeline. The start screen offers four ways in. The Copy data assistant is the one built for loading a file.
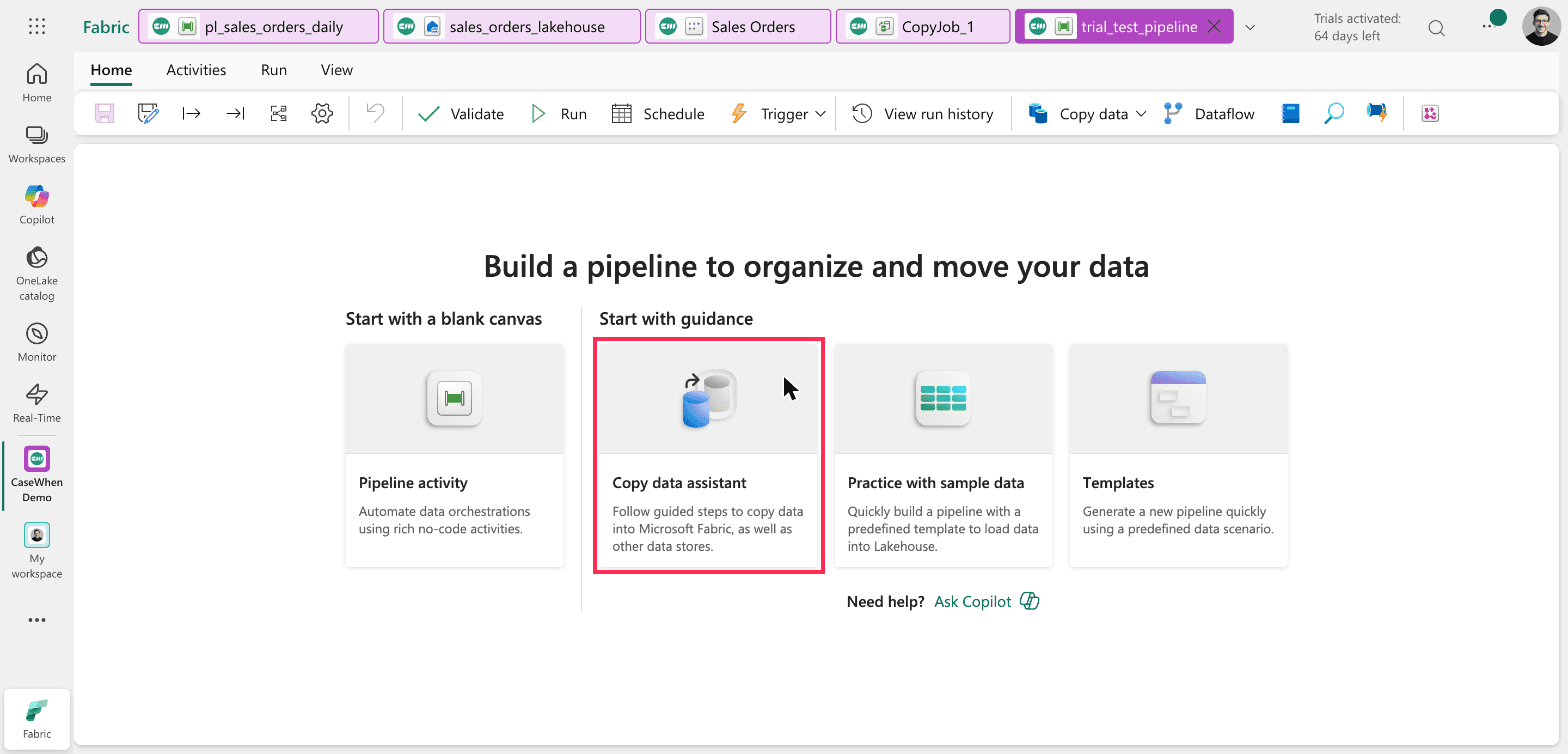
Fabric > Workspace > New item > Pipeline. The start screen, with the Copy data assistant outlined.
The assistant does not add a Copy activity to your pipeline. It creates a separate Copy job item and adds a Copy job activity that runs it. Microsoft's own first-pipeline quickstart still describes the older result, a Copy activity on the canvas, so what you see will not match it.
That matters because the Copy job holds the source, the table name and the column types. Those are edited in the Copy job, not in the pipeline.
Connect to the file
In the assistant, search for HTTP and select the Http connector. It asks for two things: a URL and an authentication kind. For a public file, the authentication kind is Anonymous.
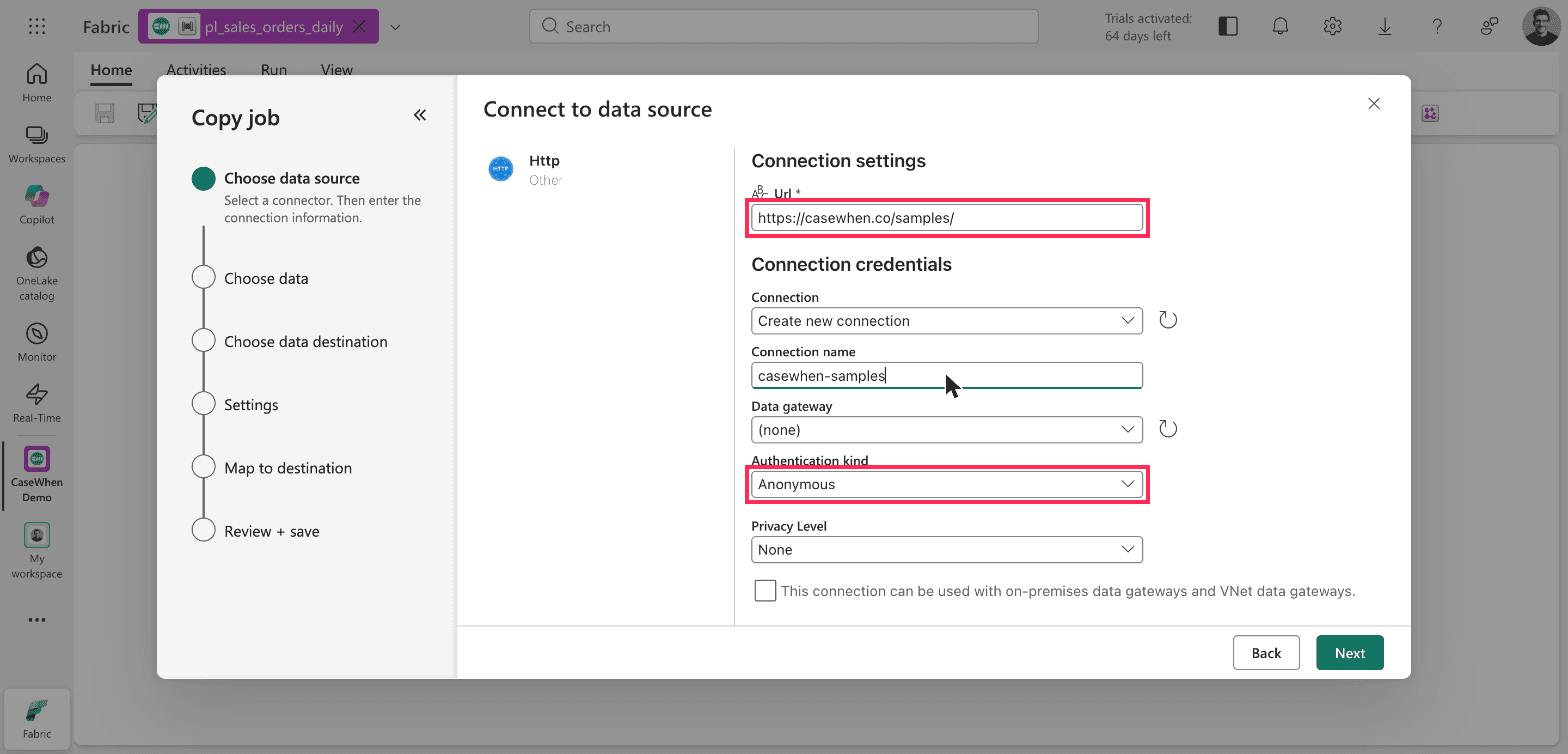
Copy data assistant > Choose data source > Http. The URL is the folder, and authentication is Anonymous.
Put the folder in the URL field, ending with a slash, and the file name on the next screen, in Relative URL. The connection then serves every file in that folder. Fabric's own 404 error message includes the same reminder: a base URL that includes a path must end with /.
Set the column types before you save
The assistant reads the file and shows a preview. The Schema tab shows the problem: every column arrives as String, including the numbers and the date.
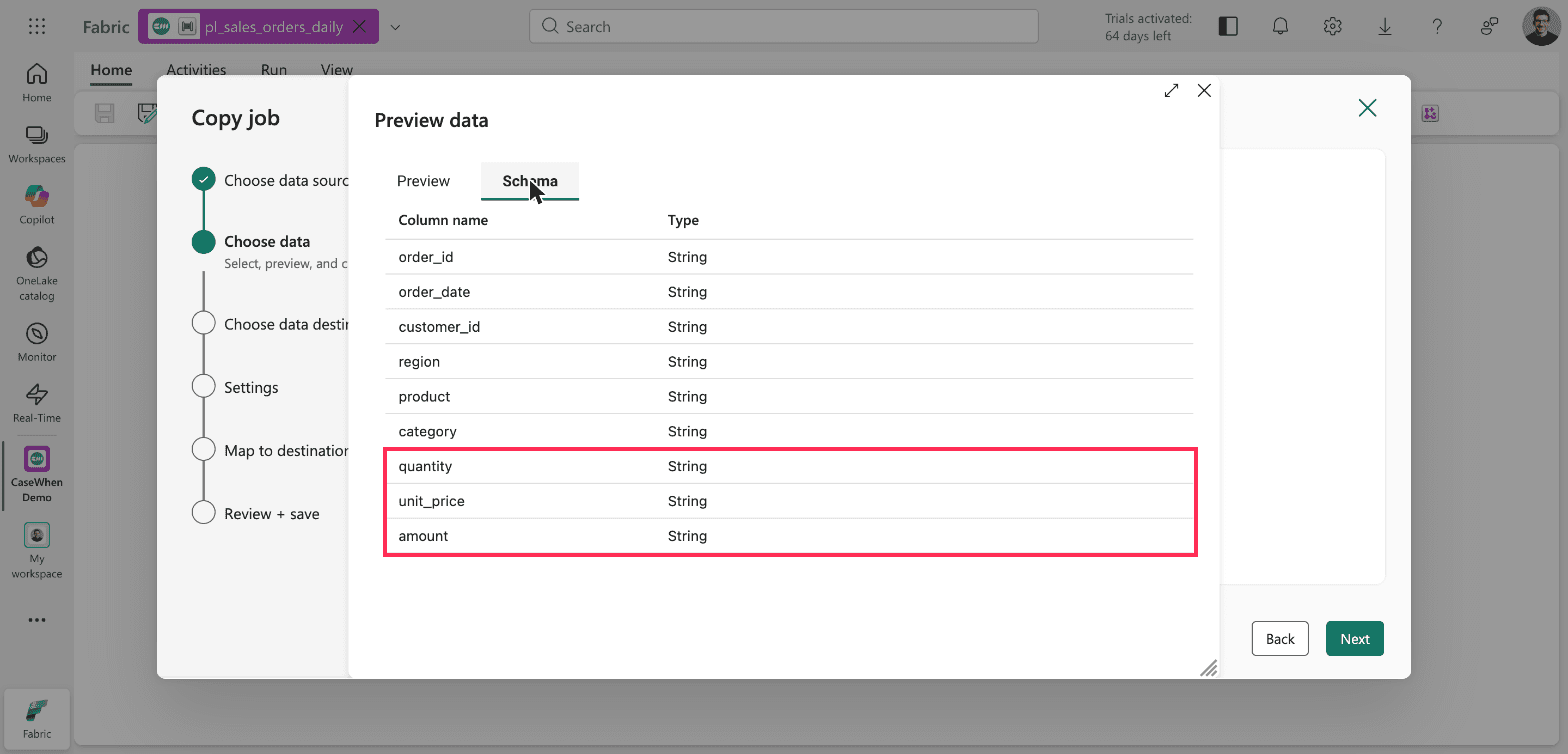
Copy data assistant > Choose data > Preview data > Schema. All nine columns are read as String.
If you save with those types, amount is text in the table, and a report cannot sum text. Fix it on the Map to destination step. Select Edit column mapping and change the destination types:
Column | Destination type |
|---|---|
| integer |
| date |
| integer |
| decimal, precision 18, scale 2 |
| decimal, precision 18, scale 2 |
The decimal type defaults to precision 38 and scale 18. For money, 18 and 2 is the usual choice.
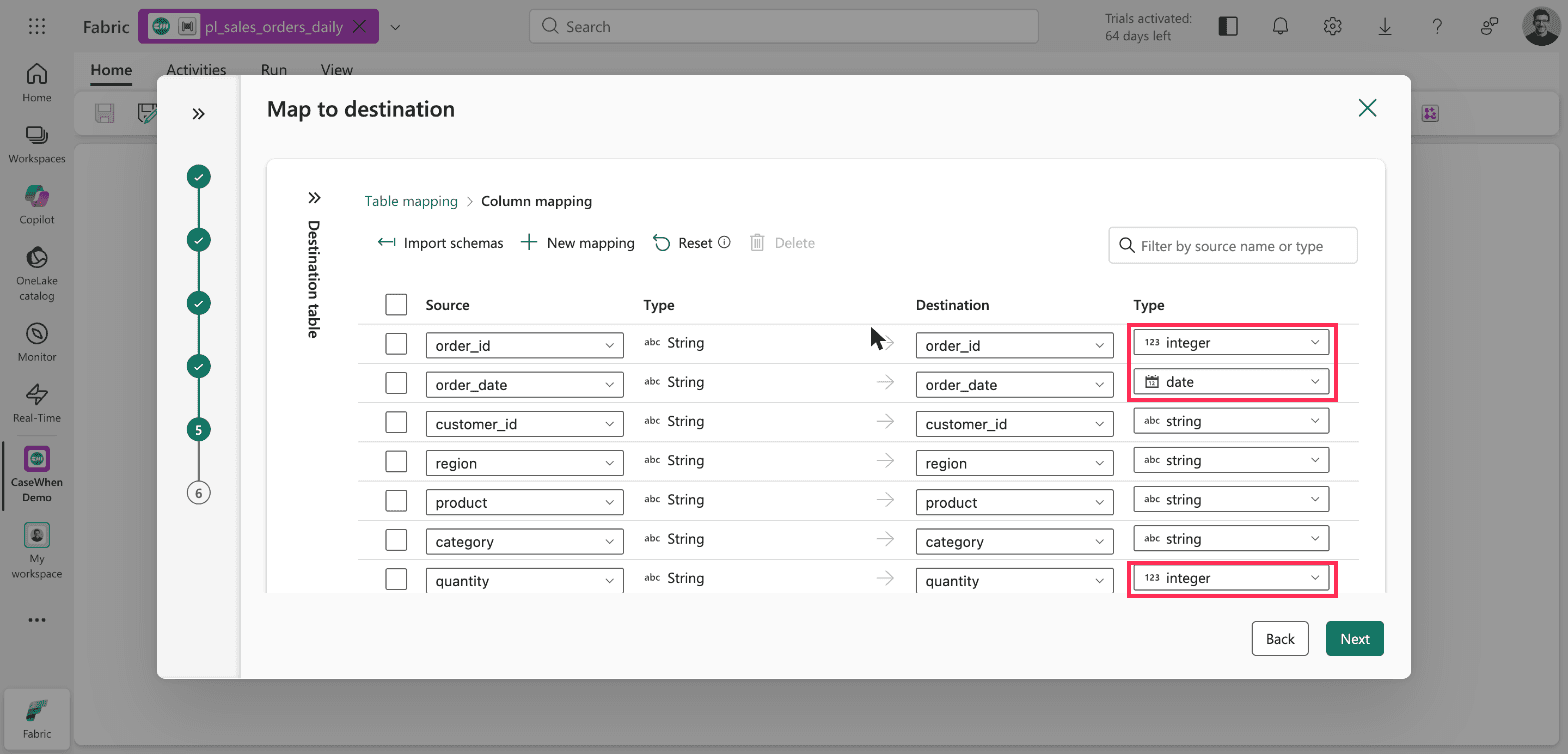
Copy data assistant > Map to destination > Edit column mapping. Destination types changed from string.
On the same step, rename the table. The assistant names it dbo.HttpServerFile after the connector, which tells nobody what it holds. This walkthrough uses dbo.sales_orders.
Every run replaces the whole table
The last step of the assistant summarizes the job. It reads "Full copy" and "Overwrite destination". Incremental copy is grayed out for an HTTP source, so full copy is the only option.
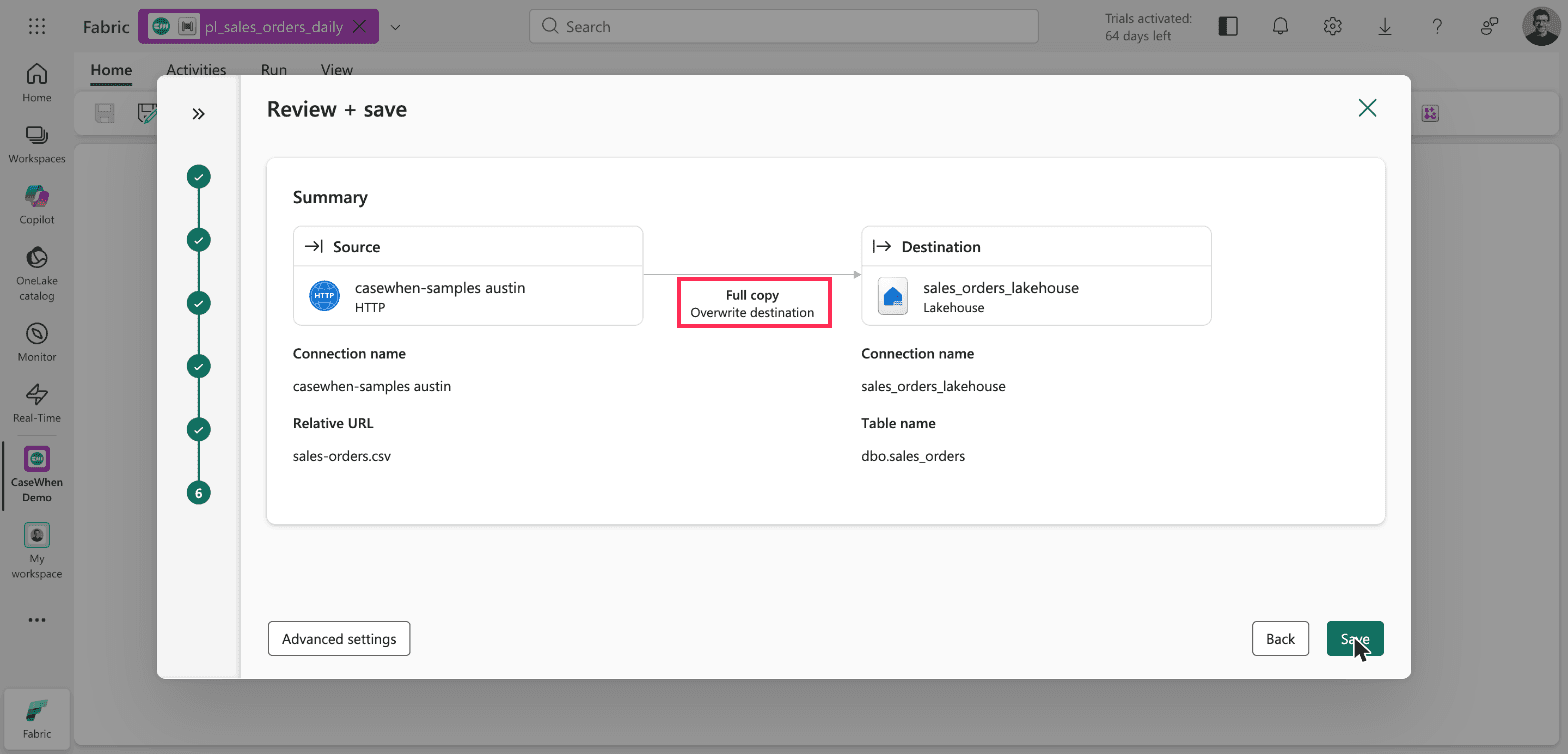
Copy data assistant > Review + save. Full copy with Overwrite destination.
Overwrite is correct when the source is a full extract, a file that holds every order each day. Each run then replaces the table with the latest complete picture. If your source only sends the new rows each day, this setup deletes the previous rows on every run. That case needs a different design.
Two defaults under Advanced settings on the same screen are worth knowing:
The timeout is 12 hours.
Retry is 0, so a single failed request fails the whole copy. This is the Copy job's own retry setting. The pipeline activity has a separate one, covered under failures below.
Give the pipeline its connection
When you save, the assistant closes and the pipeline canvas shows one Copy job activity. Its name, Copy job_c06 here, is the activity's name. The Copy job item it calls is named separately, CopyJob_1 here. You can rename the activity on its General tab.
The activity is not ready to run yet. It needs a connection of its own, which the assistant never asks for.
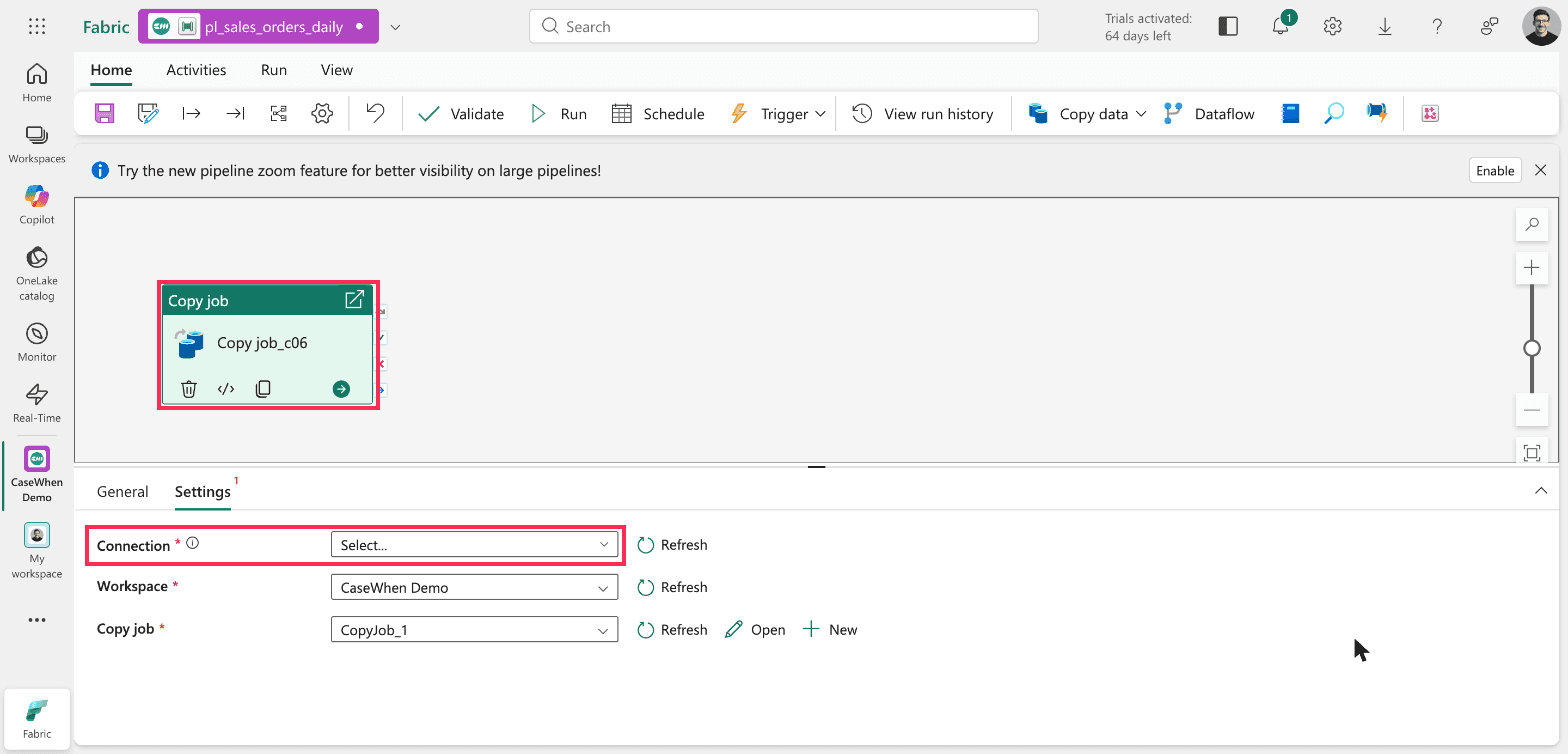
Pipeline editor > Copy job activity > Settings. The Connection field is empty and required after the assistant finishes.
To fix it, open the Connection list, select Browse all, choose Copy job, and sign in with your organizational account. This is a one-time step. The connection is saved and reused.
Check the load
Run the pipeline. The Copy job has its own results panel, and it is the quickest place to confirm a load, because it counts rows on both sides.
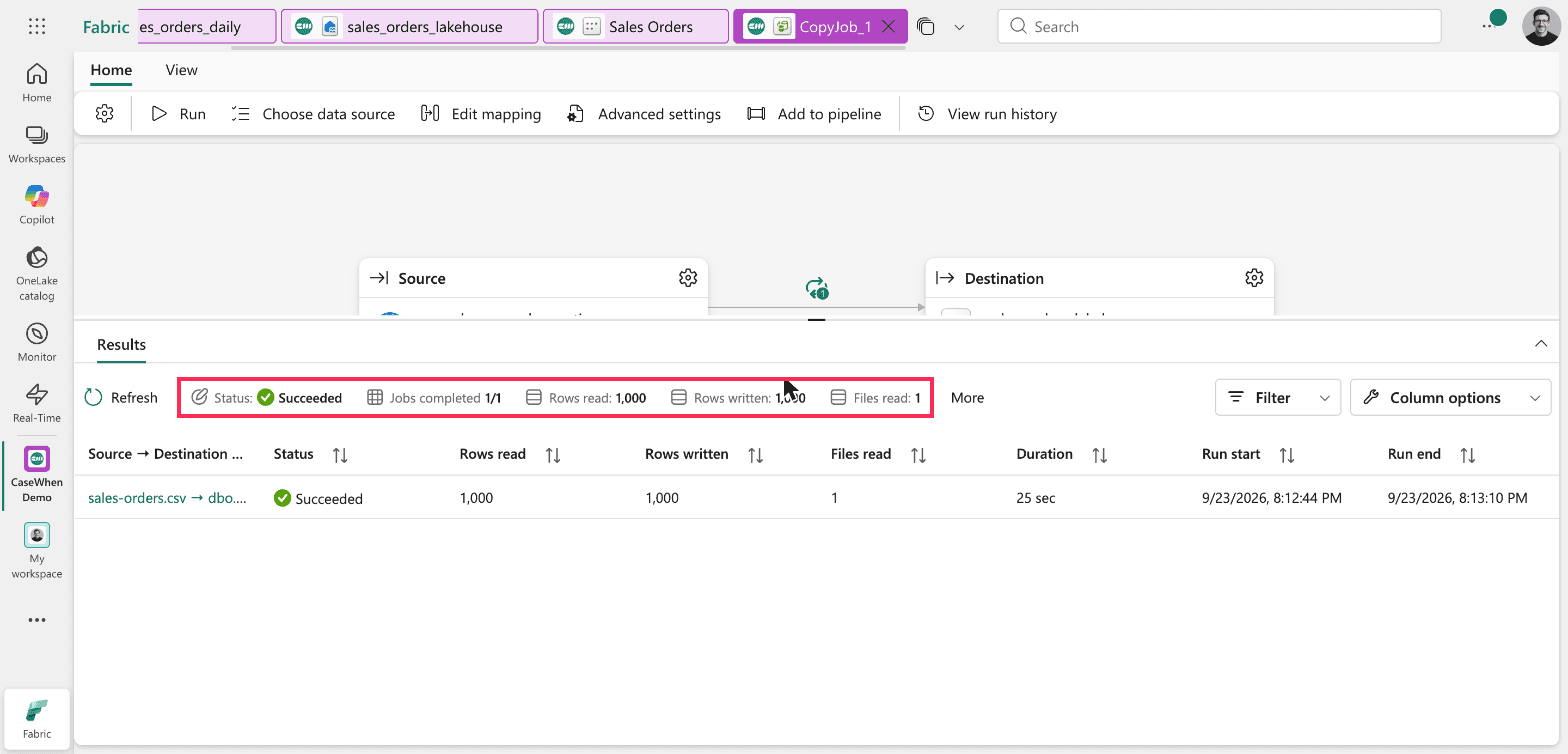
CopyJob_1 > Results. 1,000 rows read, 1,000 rows written, one file.
The first run read 1,000 rows and wrote 1,000 rows in 25 seconds. The pipeline around it took just over a minute. The lakehouse table view showed the same count, with the integer, date and decimal types from the mapping.
Build a Direct Lake model on the table
In the lakehouse, select New semantic model, give it a name and tick the table. The dialog is titled "Direct Lake semantic model name": a model created this way is Direct Lake by default. It reads the Delta table in OneLake directly instead of importing a copy. If Direct Lake is new to you, it sits between the two modes compared in DirectQuery vs Import.
To check the numbers, open the model's DAX query view and run a query that returns the row count, the total and the latest date:
EVALUATE
ROW (
    "Rows", COUNTROWS ( sales_orders ),
    "Total amount", SUM ( sales_orders[amount] ),
    "Last order date", MAX ( sales_orders[order_date] )
)
After the first load it returned 1,000 rows, a total of 299,345.10 and a last order date of 29 August 2026. Those match the source file exactly.
One small fix before you build visuals. The model marks order_id as a summable number, so a visual would add up order IDs. Set its Summarize by property to None.
Changing the source file resets your mapping
To see the report pick up new data, point the Copy job at the second sample file, sales-orders-update.csv. The same steps apply whenever you change the source. In the Copy job, the file name lives under Choose data source, in Relative URL. Change it there and step through, and the Map to destination screen comes back with the table name reset to dbo.HttpServerFile.
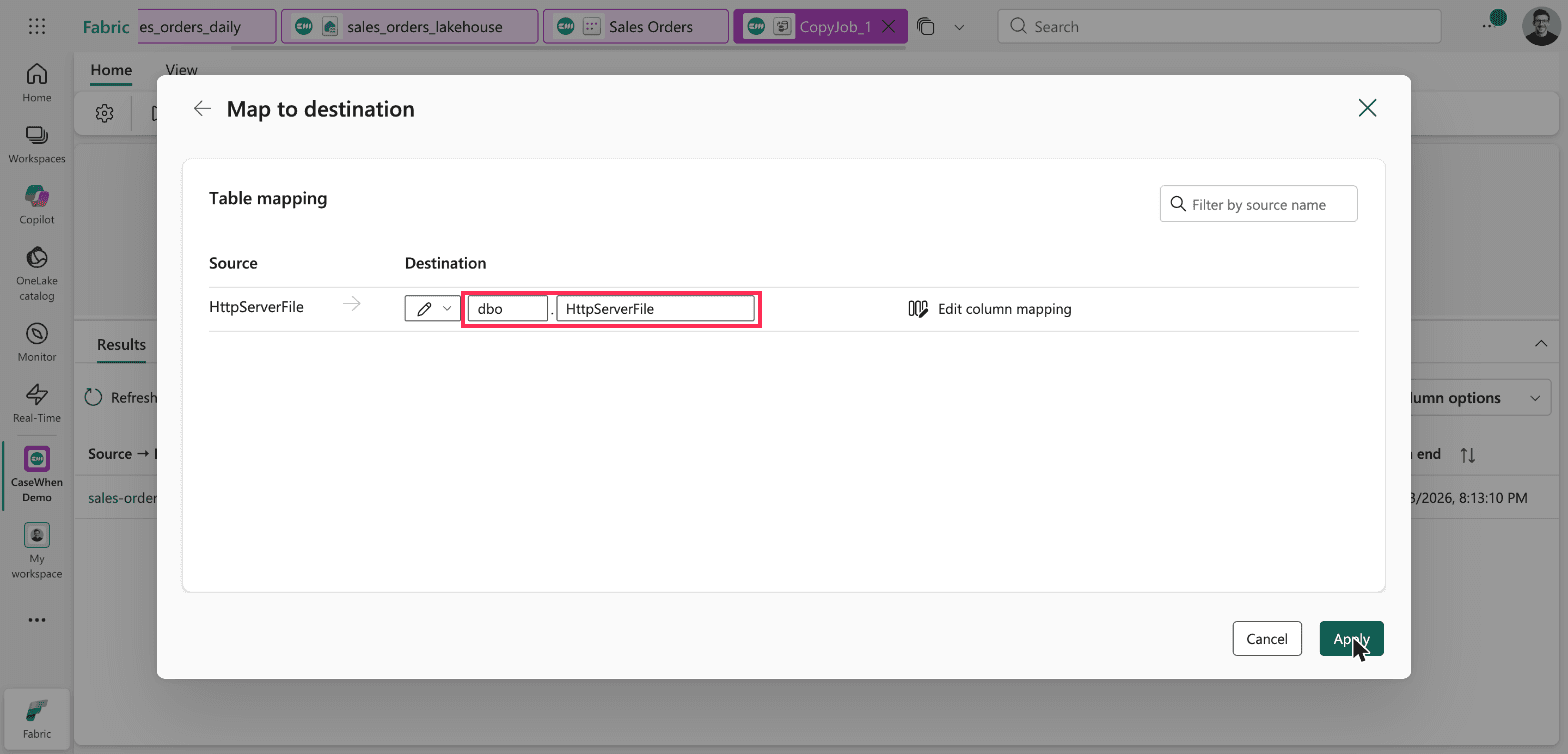
CopyJob_1 > Choose data source > Map to destination. The table name is back to the default.
The column types reset to string as well. Import schemas does not bring them back, because it imports the source's schema, which is all strings. If you apply this screen as it is, the next run writes to a new table your report does not use.
The fix takes a minute:
In the destination dropdown, switch from Enter manually to From selection.
Pick the existing
dbo.sales_orderstable.Open Edit column mapping and set the five types again.
The simpler rule is to avoid the situation. Have the source publish each day's file to the same URL, and the Copy job never needs editing.
The report updates without a refresh step
With the mapping fixed, the second run loaded sales-orders-update.csv into the same table. Nothing refreshed the semantic model. The same DAX query then returned 1,085 rows, a total of 325,311.20 and a last order date of 5 September 2026.
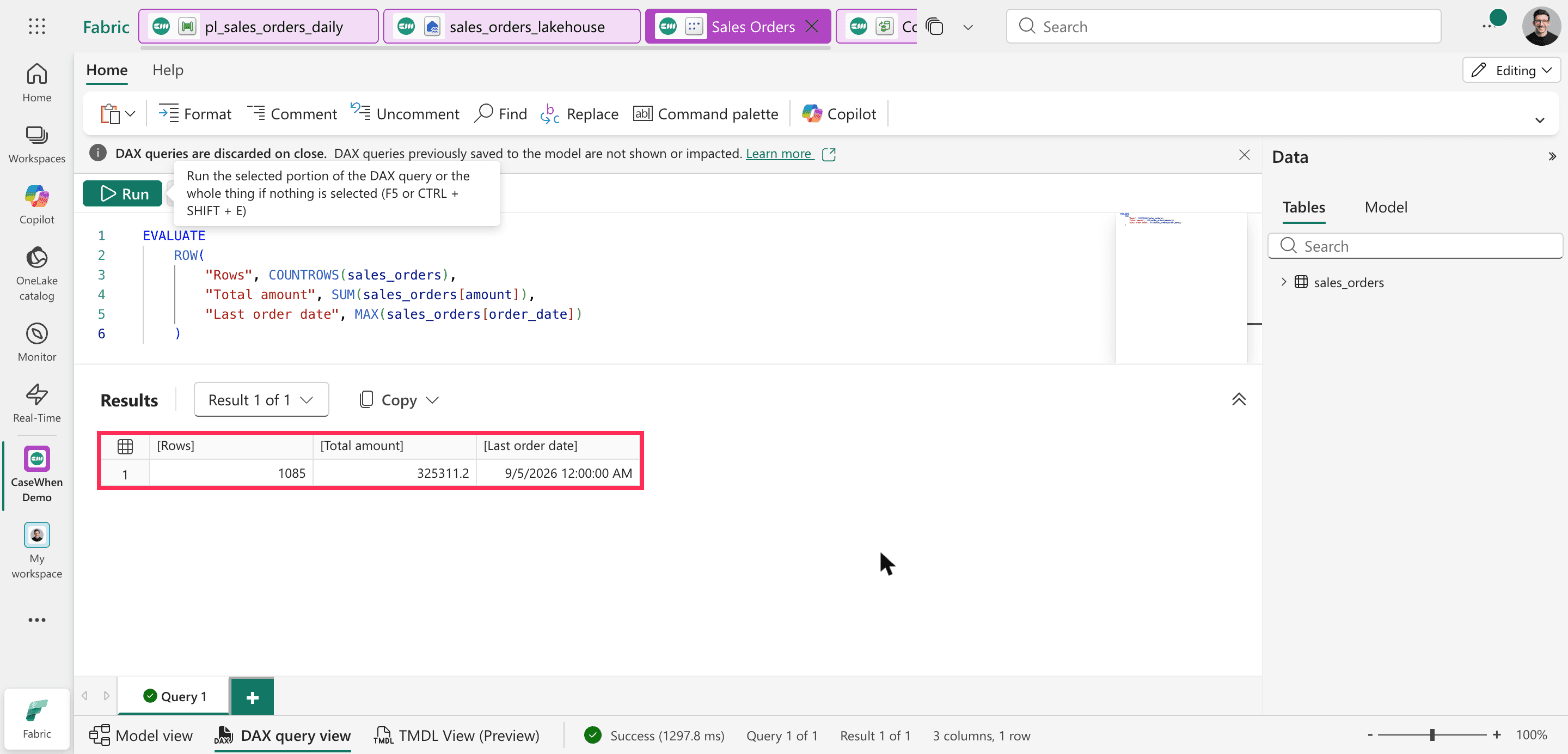
Semantic model > DAX query view. The model shows the second load's 1,085 rows with no refresh.
One check can mislead you at this point. The lakehouse's SQL analytics endpoint syncs on a delay. Right after this second run, a SQL query against the endpoint still returned 1,000 rows, while the table and the model already held 1,085. If a SQL query disagrees with the Copy job results straight after a run, wait and query again before you assume the load failed.
The model's settings show why the model already had the new rows. Under Refresh, "Keep your Direct Lake data up to date" is on for a new model. Fabric describes it as detecting changes to the data in OneLake and updating the Direct Lake tables automatically. The model's refresh history agrees: its last refresh was the moment it was created, so no refresh ran between the two loads.
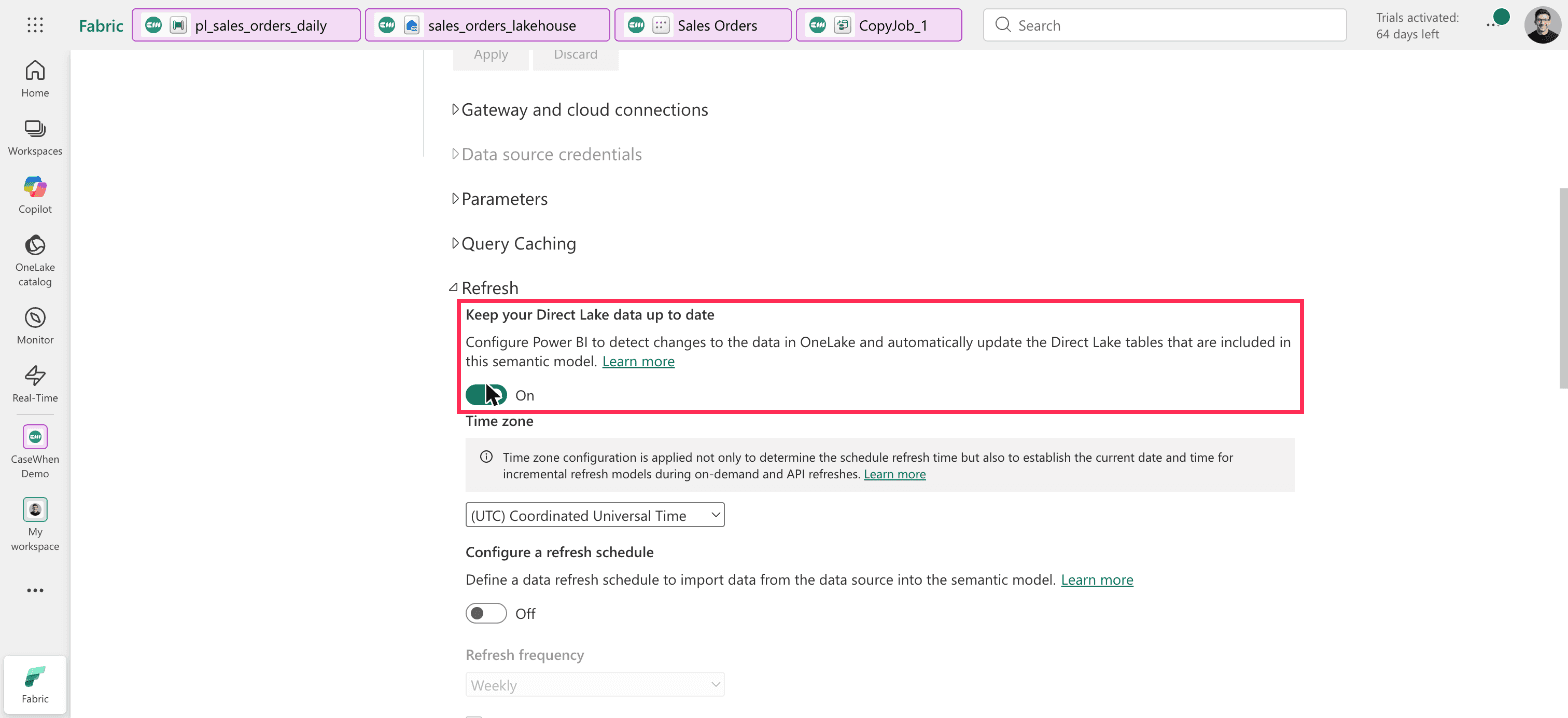
Workspace settings > Semantic models > Sales Orders > Refresh. Keep your Direct Lake data up to date is On.
You need a refresh step in two cases: when the model uses Import mode, or when this setting is off. Pipelines have a Semantic model refresh activity for that. Place it after the Copy job activity so it runs only when the copy succeeds. That activity is described here from Microsoft's documentation. The Direct Lake behavior above is what was tested.
Schedule it
In the pipeline, select Schedule, then Add schedule. The default is "By the minute", every 15 minutes, with an end date 24 hours after the start. Saved as it is, it runs 96 times and then stops.
Change Repeat to Daily. The end date then moves to 31 December 9999 on its own. Set the time of day and save.
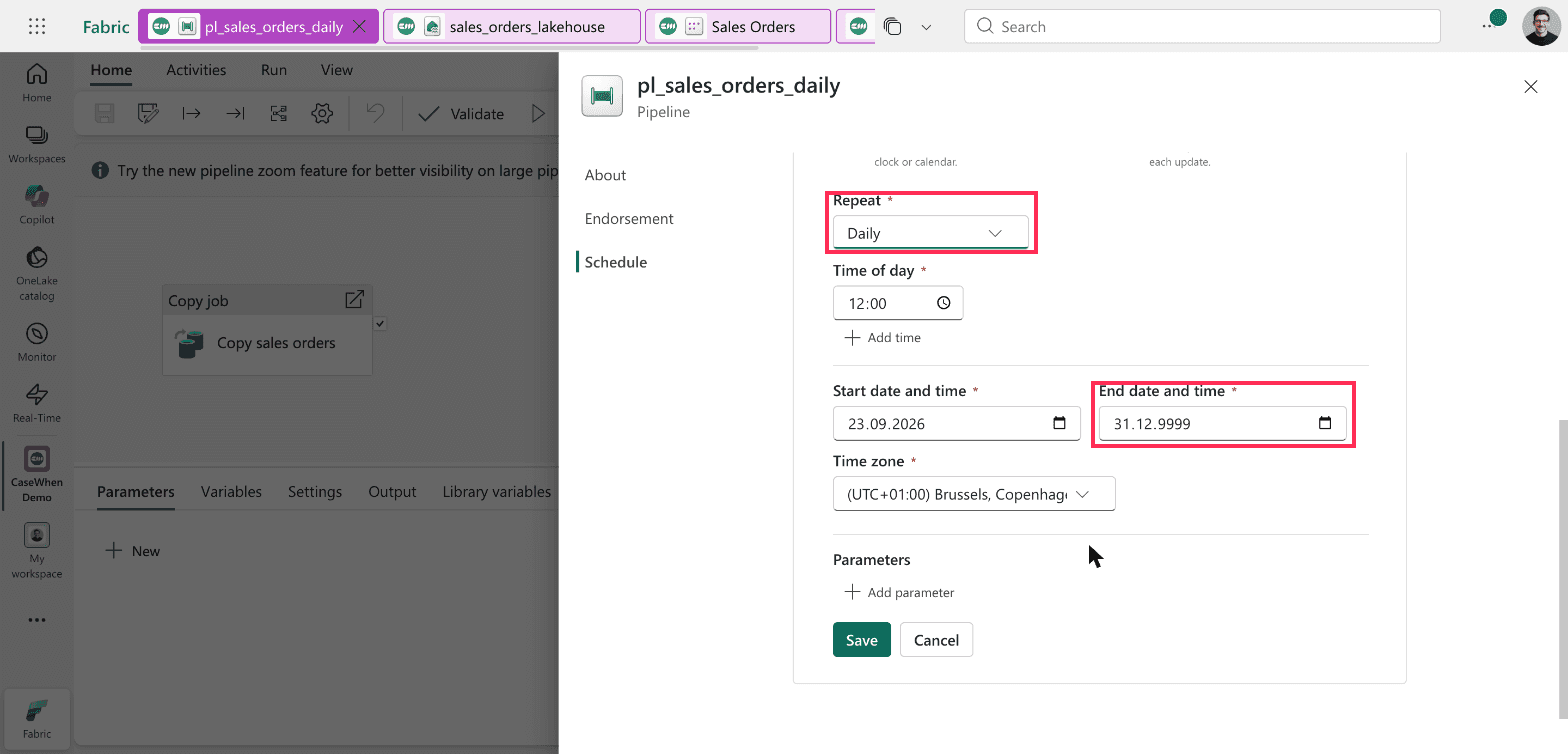
Pipeline > Schedule > Add schedule. Daily repeats until 31 December 9999.
Find out when it fails
A failed run shows up in the Monitor hub, in the left navigation, with the pipeline and the Copy job as separate rows.
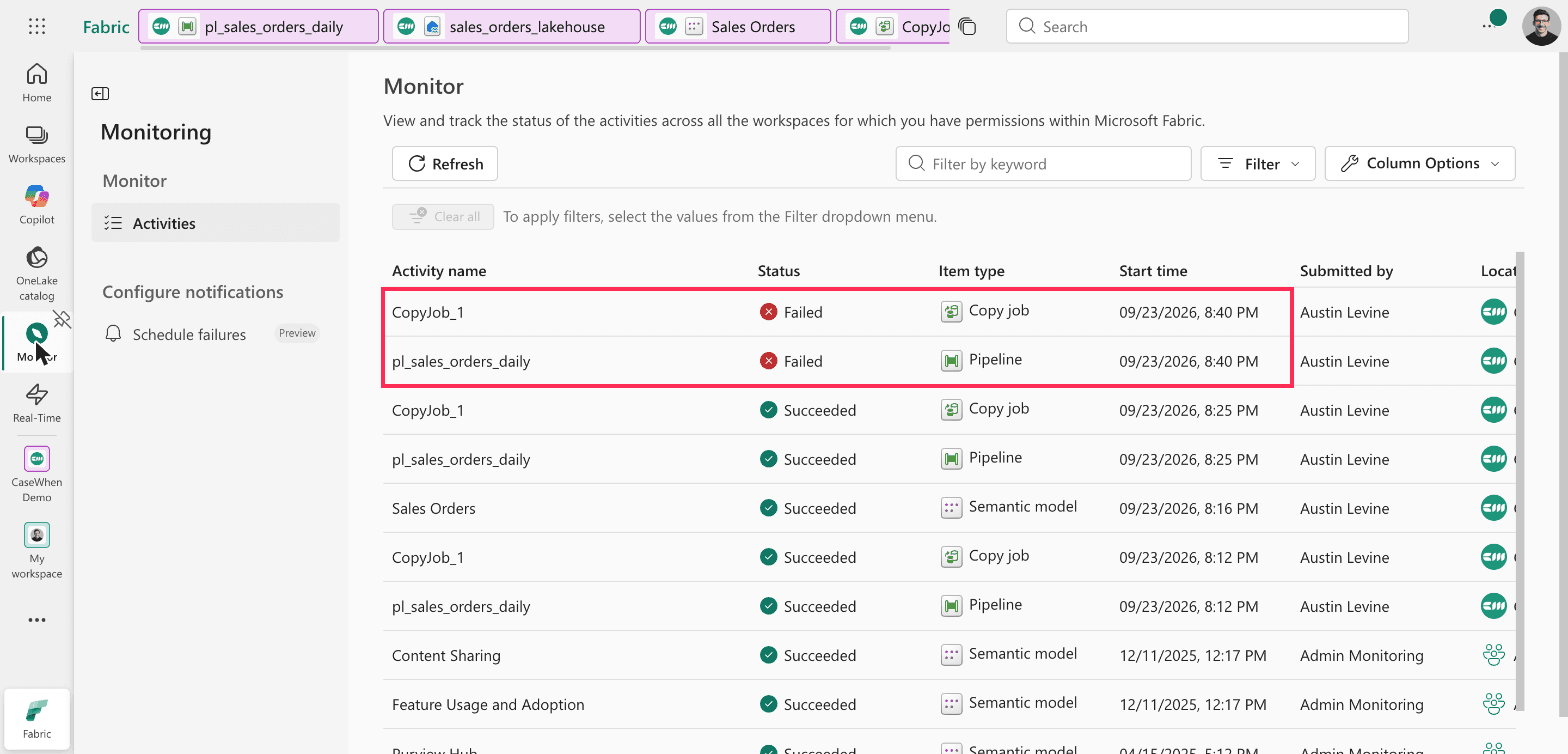
Fabric > Monitor > Activities. The pipeline and its Copy job both show Failed.
Select the details icon on the pipeline row. The Details panel cuts the message off at "error message received from ...". Select the Copy error button in that panel to copy the full message. For a missing file, it reads "Http request failed with client error, status code 404 NotFound".
The pipeline's Copy job activity has its own retry setting, separate from the Copy job's. On the activity's General tab, Enable retries sits under the timeout. Turning it on means a brief outage at the source does not fail the whole morning's load.
What happens when the trial ends
A trial lasts 60 days. The pipeline, the Copy job and the lakehouse are all non-Power BI items, and when the trial ends they become unusable and may be deleted. You get seven days after expiry to keep them by moving the workspace to a paid F or P capacity. The semantic model is a Power BI item, but it reads from the lakehouse, so it has nothing to show once the lakehouse is gone.
If this build is the start of something real, plan the capacity before the trial runs out, not after. If you already run Azure Data Factory and want to know how the Fabric version differs, see Data Factory in Fabric vs Azure.
Sources
Create your first pipeline to copy data - Microsoft Learn
Fabric trial capacity - Microsoft Learn
Direct Lake overview - Microsoft Learn
Semantic model refresh activity in Data Factory - Microsoft Learn
The build in this article, from source file to report.
Create a pipeline, run the Copy data assistant to load your file into a lakehouse table, and set the column types before you save. Then add a daily schedule. If your report reads the table through a Direct Lake semantic model, it shows the new data after every run with no refresh step. All of it works on the free Fabric trial.
Tested on a live Fabric trial capacity, SKU FTL64, loading a public CSV file over HTTP into a lakehouse and reading it through a Direct Lake semantic model.
What a pipeline is, and what this one builds
A pipeline in Fabric is the part that runs data work on a schedule. It does not move or change data itself. It runs steps in a set order, starts them at the time you choose, and records whether each one succeeded. The steps inside it do the actual work.
Almost every pipeline has the same four stages, and each stage uses a different Fabric tool:
Stage | What happens | Fabric tool in this article |
|---|---|---|
1. Get the data | Read it from where it lives, a file, database or API | Copy job |
2. Store it | Write it to a table in Fabric | Lakehouse table |
3. Serve it | Make the table available to reports | Direct Lake semantic model |
4. Run and watch | Start stage 1 on a schedule and record failures | Pipeline, plus the Monitor hub |
Fabric has several tools for stage 1. Workspace > New item lists them together under Get data: Copy job, Dataflow Gen2, Pipeline and Notebook, among others. A Copy job copies data as it is, which is all a first pipeline needs. Dataflow Gen2 reshapes data with Power Query on the way in, and a notebook does it in code. Dataflows vs Notebooks in Fabric compares those two.
Everything below runs on a Fabric trial. Pipelines, lakehouses and semantic models all work on a trial. Only the AI features are blocked. You also sign in once with your work account while setting up the pipeline.
You can follow along with the same data. The first file holds 1,000 daily sales orders: https://casewhen.co/samples/sales-orders.csv. A second file, used later to show the report updating, holds the same orders plus one more week, 1,085 in total: https://casewhen.co/samples/sales-orders-update.csv.
The Copy data assistant now creates a Copy job
Open your workspace and select New item, then Pipeline. The start screen offers four ways in. The Copy data assistant is the one built for loading a file.
Fabric > Workspace > New item > Pipeline. The start screen, with the Copy data assistant outlined.
The assistant does not add a Copy activity to your pipeline. It creates a separate Copy job item and adds a Copy job activity that runs it. Microsoft's own first-pipeline quickstart still describes the older result, a Copy activity on the canvas, so what you see will not match it.
That matters because the Copy job holds the source, the table name and the column types. Those are edited in the Copy job, not in the pipeline.
Connect to the file
In the assistant, search for HTTP and select the Http connector. It asks for two things: a URL and an authentication kind. For a public file, the authentication kind is Anonymous.
Copy data assistant > Choose data source > Http. The URL is the folder, and authentication is Anonymous.
Put the folder in the URL field, ending with a slash, and the file name on the next screen, in Relative URL. The connection then serves every file in that folder. Fabric's own 404 error message includes the same reminder: a base URL that includes a path must end with /.
Set the column types before you save
The assistant reads the file and shows a preview. The Schema tab shows the problem: every column arrives as String, including the numbers and the date.
Copy data assistant > Choose data > Preview data > Schema. All nine columns are read as String.
If you save with those types, amount is text in the table, and a report cannot sum text. Fix it on the Map to destination step. Select Edit column mapping and change the destination types:
Column | Destination type |
|---|---|
| integer |
| date |
| integer |
| decimal, precision 18, scale 2 |
| decimal, precision 18, scale 2 |
The decimal type defaults to precision 38 and scale 18. For money, 18 and 2 is the usual choice.
Copy data assistant > Map to destination > Edit column mapping. Destination types changed from string.
On the same step, rename the table. The assistant names it dbo.HttpServerFile after the connector, which tells nobody what it holds. This walkthrough uses dbo.sales_orders.
Every run replaces the whole table
The last step of the assistant summarizes the job. It reads "Full copy" and "Overwrite destination". Incremental copy is grayed out for an HTTP source, so full copy is the only option.
Copy data assistant > Review + save. Full copy with Overwrite destination.
Overwrite is correct when the source is a full extract, a file that holds every order each day. Each run then replaces the table with the latest complete picture. If your source only sends the new rows each day, this setup deletes the previous rows on every run. That case needs a different design.
Two defaults under Advanced settings on the same screen are worth knowing:
The timeout is 12 hours.
Retry is 0, so a single failed request fails the whole copy. This is the Copy job's own retry setting. The pipeline activity has a separate one, covered under failures below.
Give the pipeline its connection
When you save, the assistant closes and the pipeline canvas shows one Copy job activity. Its name, Copy job_c06 here, is the activity's name. The Copy job item it calls is named separately, CopyJob_1 here. You can rename the activity on its General tab.
The activity is not ready to run yet. It needs a connection of its own, which the assistant never asks for.
Pipeline editor > Copy job activity > Settings. The Connection field is empty and required after the assistant finishes.
To fix it, open the Connection list, select Browse all, choose Copy job, and sign in with your organizational account. This is a one-time step. The connection is saved and reused.
Check the load
Run the pipeline. The Copy job has its own results panel, and it is the quickest place to confirm a load, because it counts rows on both sides.
CopyJob_1 > Results. 1,000 rows read, 1,000 rows written, one file.
The first run read 1,000 rows and wrote 1,000 rows in 25 seconds. The pipeline around it took just over a minute. The lakehouse table view showed the same count, with the integer, date and decimal types from the mapping.
Build a Direct Lake model on the table
In the lakehouse, select New semantic model, give it a name and tick the table. The dialog is titled "Direct Lake semantic model name": a model created this way is Direct Lake by default. It reads the Delta table in OneLake directly instead of importing a copy. If Direct Lake is new to you, it sits between the two modes compared in DirectQuery vs Import.
To check the numbers, open the model's DAX query view and run a query that returns the row count, the total and the latest date:
EVALUATE
ROW (
    "Rows", COUNTROWS ( sales_orders ),
    "Total amount", SUM ( sales_orders[amount] ),
    "Last order date", MAX ( sales_orders[order_date] )
)
After the first load it returned 1,000 rows, a total of 299,345.10 and a last order date of 29 August 2026. Those match the source file exactly.
One small fix before you build visuals. The model marks order_id as a summable number, so a visual would add up order IDs. Set its Summarize by property to None.
Changing the source file resets your mapping
To see the report pick up new data, point the Copy job at the second sample file, sales-orders-update.csv. The same steps apply whenever you change the source. In the Copy job, the file name lives under Choose data source, in Relative URL. Change it there and step through, and the Map to destination screen comes back with the table name reset to dbo.HttpServerFile.
CopyJob_1 > Choose data source > Map to destination. The table name is back to the default.
The column types reset to string as well. Import schemas does not bring them back, because it imports the source's schema, which is all strings. If you apply this screen as it is, the next run writes to a new table your report does not use.
The fix takes a minute:
In the destination dropdown, switch from Enter manually to From selection.
Pick the existing
dbo.sales_orderstable.Open Edit column mapping and set the five types again.
The simpler rule is to avoid the situation. Have the source publish each day's file to the same URL, and the Copy job never needs editing.
The report updates without a refresh step
With the mapping fixed, the second run loaded sales-orders-update.csv into the same table. Nothing refreshed the semantic model. The same DAX query then returned 1,085 rows, a total of 325,311.20 and a last order date of 5 September 2026.
Semantic model > DAX query view. The model shows the second load's 1,085 rows with no refresh.
One check can mislead you at this point. The lakehouse's SQL analytics endpoint syncs on a delay. Right after this second run, a SQL query against the endpoint still returned 1,000 rows, while the table and the model already held 1,085. If a SQL query disagrees with the Copy job results straight after a run, wait and query again before you assume the load failed.
The model's settings show why the model already had the new rows. Under Refresh, "Keep your Direct Lake data up to date" is on for a new model. Fabric describes it as detecting changes to the data in OneLake and updating the Direct Lake tables automatically. The model's refresh history agrees: its last refresh was the moment it was created, so no refresh ran between the two loads.
Workspace settings > Semantic models > Sales Orders > Refresh. Keep your Direct Lake data up to date is On.
You need a refresh step in two cases: when the model uses Import mode, or when this setting is off. Pipelines have a Semantic model refresh activity for that. Place it after the Copy job activity so it runs only when the copy succeeds. That activity is described here from Microsoft's documentation. The Direct Lake behavior above is what was tested.
Schedule it
In the pipeline, select Schedule, then Add schedule. The default is "By the minute", every 15 minutes, with an end date 24 hours after the start. Saved as it is, it runs 96 times and then stops.
Change Repeat to Daily. The end date then moves to 31 December 9999 on its own. Set the time of day and save.
Pipeline > Schedule > Add schedule. Daily repeats until 31 December 9999.
Find out when it fails
A failed run shows up in the Monitor hub, in the left navigation, with the pipeline and the Copy job as separate rows.
Fabric > Monitor > Activities. The pipeline and its Copy job both show Failed.
Select the details icon on the pipeline row. The Details panel cuts the message off at "error message received from ...". Select the Copy error button in that panel to copy the full message. For a missing file, it reads "Http request failed with client error, status code 404 NotFound".
The pipeline's Copy job activity has its own retry setting, separate from the Copy job's. On the activity's General tab, Enable retries sits under the timeout. Turning it on means a brief outage at the source does not fail the whole morning's load.
What happens when the trial ends
A trial lasts 60 days. The pipeline, the Copy job and the lakehouse are all non-Power BI items, and when the trial ends they become unusable and may be deleted. You get seven days after expiry to keep them by moving the workspace to a paid F or P capacity. The semantic model is a Power BI item, but it reads from the lakehouse, so it has nothing to show once the lakehouse is gone.
If this build is the start of something real, plan the capacity before the trial runs out, not after. If you already run Azure Data Factory and want to know how the Fabric version differs, see Data Factory in Fabric vs Azure.
Sources
Create your first pipeline to copy data - Microsoft Learn
Fabric trial capacity - Microsoft Learn
Direct Lake overview - Microsoft Learn
Semantic model refresh activity in Data Factory - Microsoft Learn
Show us your report nobody trusts.
1 · A 30-minute call.
2 · We look at your current reports together.
3 · We tell you what we would do.
Show us your report nobody trusts.
1 · A 30-minute call.
2 · We look at your current reports together.
3 · We tell you what we would do.
Show us your report nobody trusts.
1 · A 30-minute call.
2 · We look at your current reports together.
3 · We tell you what we would do.

CaseWhen is a Berlin BI consultancy that builds reporting that leaders can trust, on the Microsoft stack: Power BI, Fabric and Azure.
Berlin, Germany
Free tools
CaseWhen is a Berlin BI consultancy that builds reporting that leaders can trust, on the Microsoft stack: Power BI, Fabric and Azure.
Berlin, Germany
Free tools
CaseWhen is a Berlin BI consultancy that builds reporting that leaders can trust, on the Microsoft stack: Power BI, Fabric and Azure.
Berlin, Germany